Yandex.Metrica is a tool for web analytics from Yandex, one of the largest search engines in Europe. The tool is in many ways similar to Google Analytics because it is free and can be installed easily on your website or app.
For a Western specialist, the search engine, Yandex, is almost unknown, not to mention the Metrica, especially since any specialist will ask the question: “Why should I use Yandex Metrica when there is Google Analytics?”. Well there are some incredibly good reasons why you should still try the Metrica, and I will share these with you.
1. Session Replay (Webvisor)
This is the main reason that makes the Metrica interesting. In short, Session Replay allows you to view a video of each session of a user on your site, including:
- All the parts of the page that was clicked on
- How they moved through the pages and where they finished their journey
- How they filled out various forms like subscriptions to email newsletters, registrations, feedback forms, authorizations, etc.
- How they reacted and worked with interactive elements on the site
- Which parts of your page the user required the most time to understand
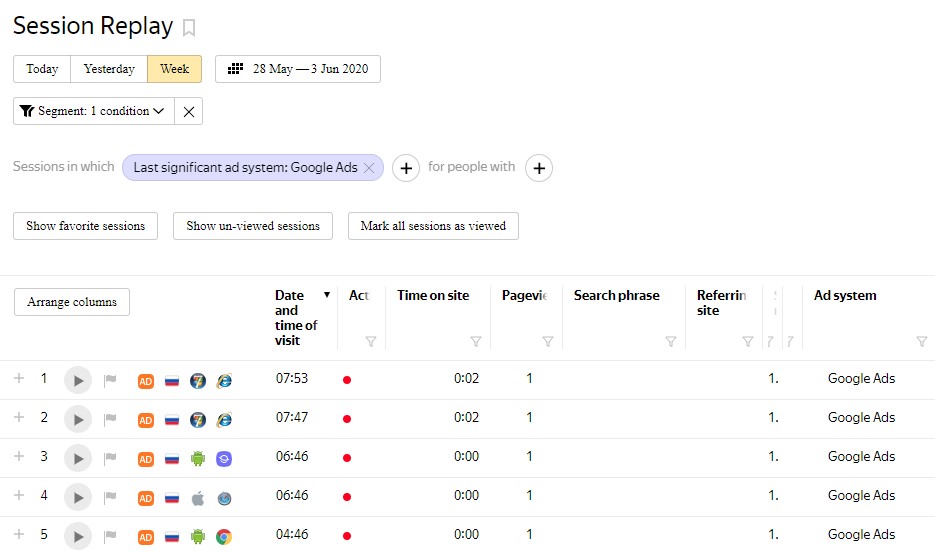
This shows the characteristics of this session, including source, channel, resolution and browser type, time spent on the site, operating system, visit numbers, UTM parameters data (if any), etc. You can also filter records based on any of these characteristics. For convenience, there are four play speeds, from normal to the fastest.
In general, Session Replay does not have free analogues, but Visitor Recordings in Hotjar can be mentioned as a paid analogue.
The main thing that Session Replay offers is the easiest and most accessible way to assess how users interact with your site. This is especially true if you are not strong in web analytics, or if you have a small project with insufficient data that needs serious analysis. In Session Replay everything is simple:
You get a list of visits to your site in the last fifteen days, choose anyone, click play and see what the user did.
Sometimes, watching Session Replay allows you to find the maximum number of flaws on the site, for example:
- On iPhone 7 at the site’s hat floats layout, the phone number does not have a preliminary formatting, which in a particular operating system glitches the JavaScript block
- No one is looking at the text in the footer that you’ve been working on for a week
All these findings can be obtained through the analysis of large reports in Google Analytics, but again, you have to have a lot of data, and you need to be a very experienced web analyst to see it all. With Session Replay it’s all right there in front of your eyes, and all you need to do is watch 30 to 40 user visits to get useful insights about how users interact with your site.
2. Click Map
Of course, this tool has a lot of analogues, including the already mentioned Hotjar.com or various extensions of Google Analytics. It is important to understand that you get this tool, as well as the entire metric, absolutely free.
Click Map shows those parts of the site that your visitors most often click on. Please note that clicks do not always show the direction of the user’s view. Most often the click card will show you those elements of the site that suffer from the point of view of usability, for example, items that users mistake for buttons or links and after clicking on them, wait to get a result.
3. Scroll Map
Scroll Map shows the page parts that are most often viewed by visitors to your site. With this tool, we can understand which blocks of the site need to be refined, what is the optimal length of the page and other useful information.
The data in the Scroll map can be presented as a heat map, where the most viewed parts are represented by red areas, as well as in the form of a transparency map, where the degree transparency correlates with the time it takes to view sections of the page.
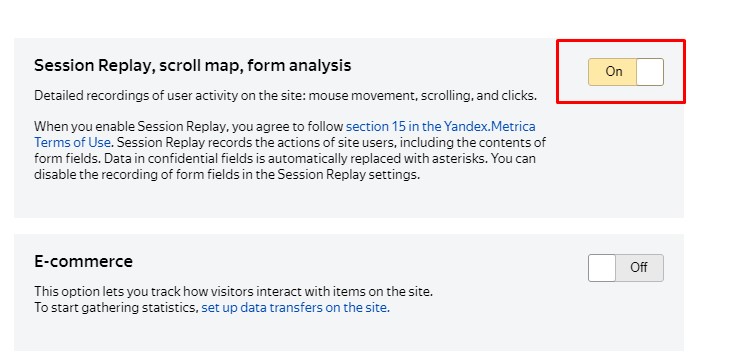
I hope I have piqued your interest in Yandex.Metrica with these reasons to try it out. The Metrica is set simply; it’s a snippet of JS-code that needs to be placed on all the pages of your site. Its code can be installed through Google Tag Manager and all you need to do is go to https://metrica.yandex.com/about page and follow the instructions there. Please note that if you also want the tools that are discussed in this article, you need to activate them on the page with the preferences of JS-code.